Fraud Detection
frauddetection-bice.vercel.app ↗Source ↗
Overview
A fraud detection model trained on the IEEE-CIS Fraud Detection dataset, with a dashboard that scores individual transactions and shows the features behind each score. Built as a class project, so the modeling itself drew on course resources, while the deployment, the interface, and the explainability layer were my own work.
The goal was a model that could score a transaction in real time, catch a meaningful share of fraudulent dollars, and explain why it flagged what it flagged. That last requirement did more to shape the project than the other two.
Approach
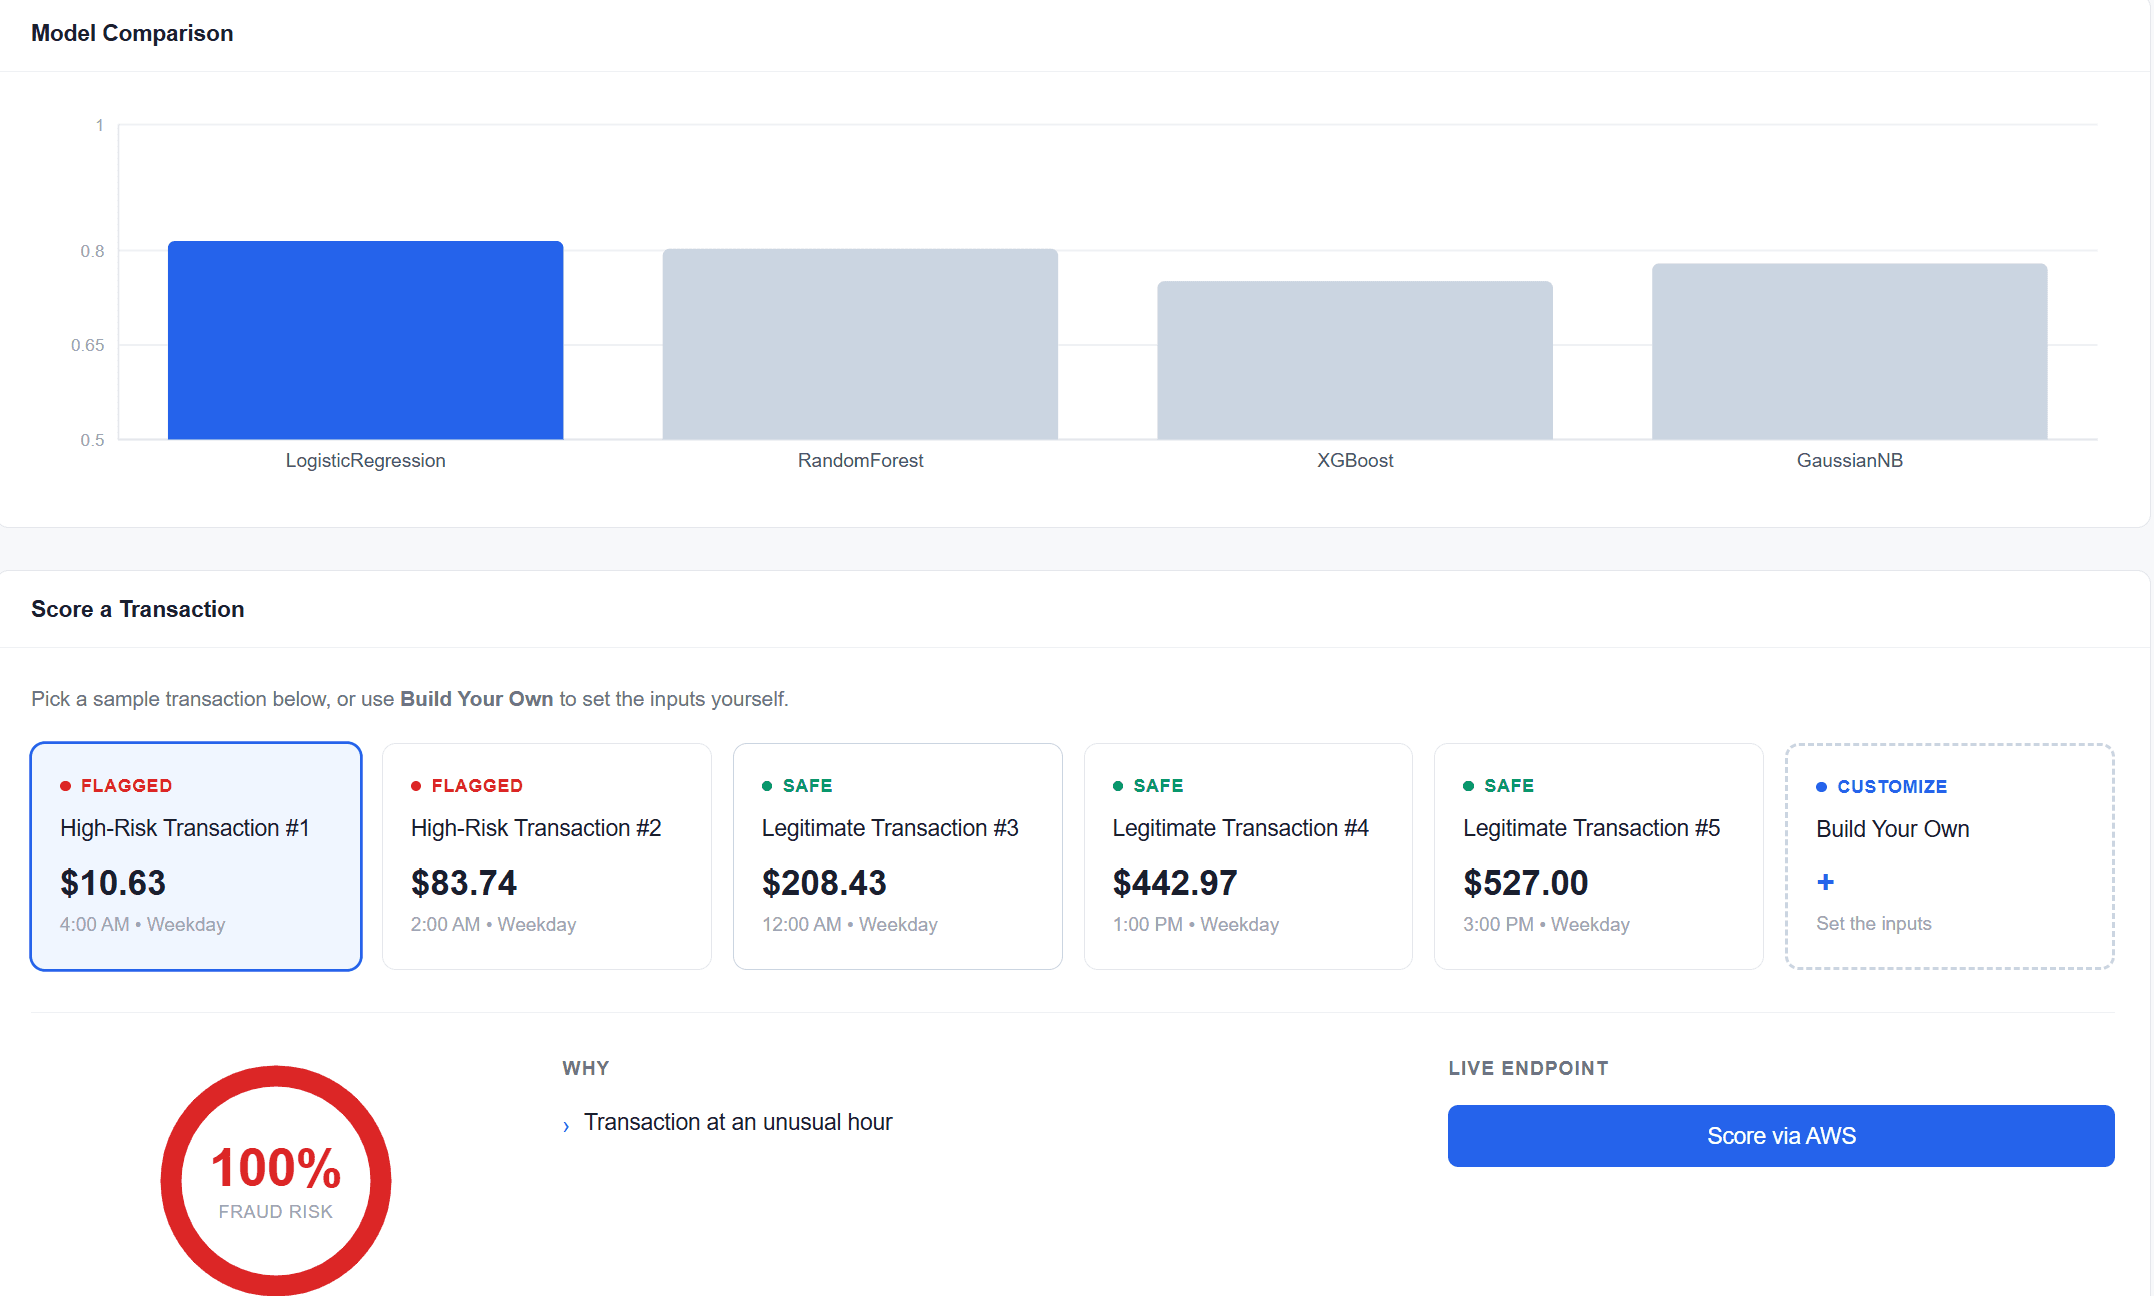
I compared four models on held-out ROC-AUC: logistic regression, random forest, XGBoost, and Gaussian naive Bayes. Tuned logistic regression performed best at 0.81. I had expected one of the tree-based models to win, and on the full dataset it probably would have.
The final pipeline was deployed as an AWS SageMaker endpoint. A Vercel-hosted dashboard calls it with a JSON payload of transaction features and gets back a fraud probability and a recommended action, at sub-second latency. Anything at or above 0.50 comes back FLAGGED, between 0.25 and 0.50 REVIEW, and below that SAFE.
Results
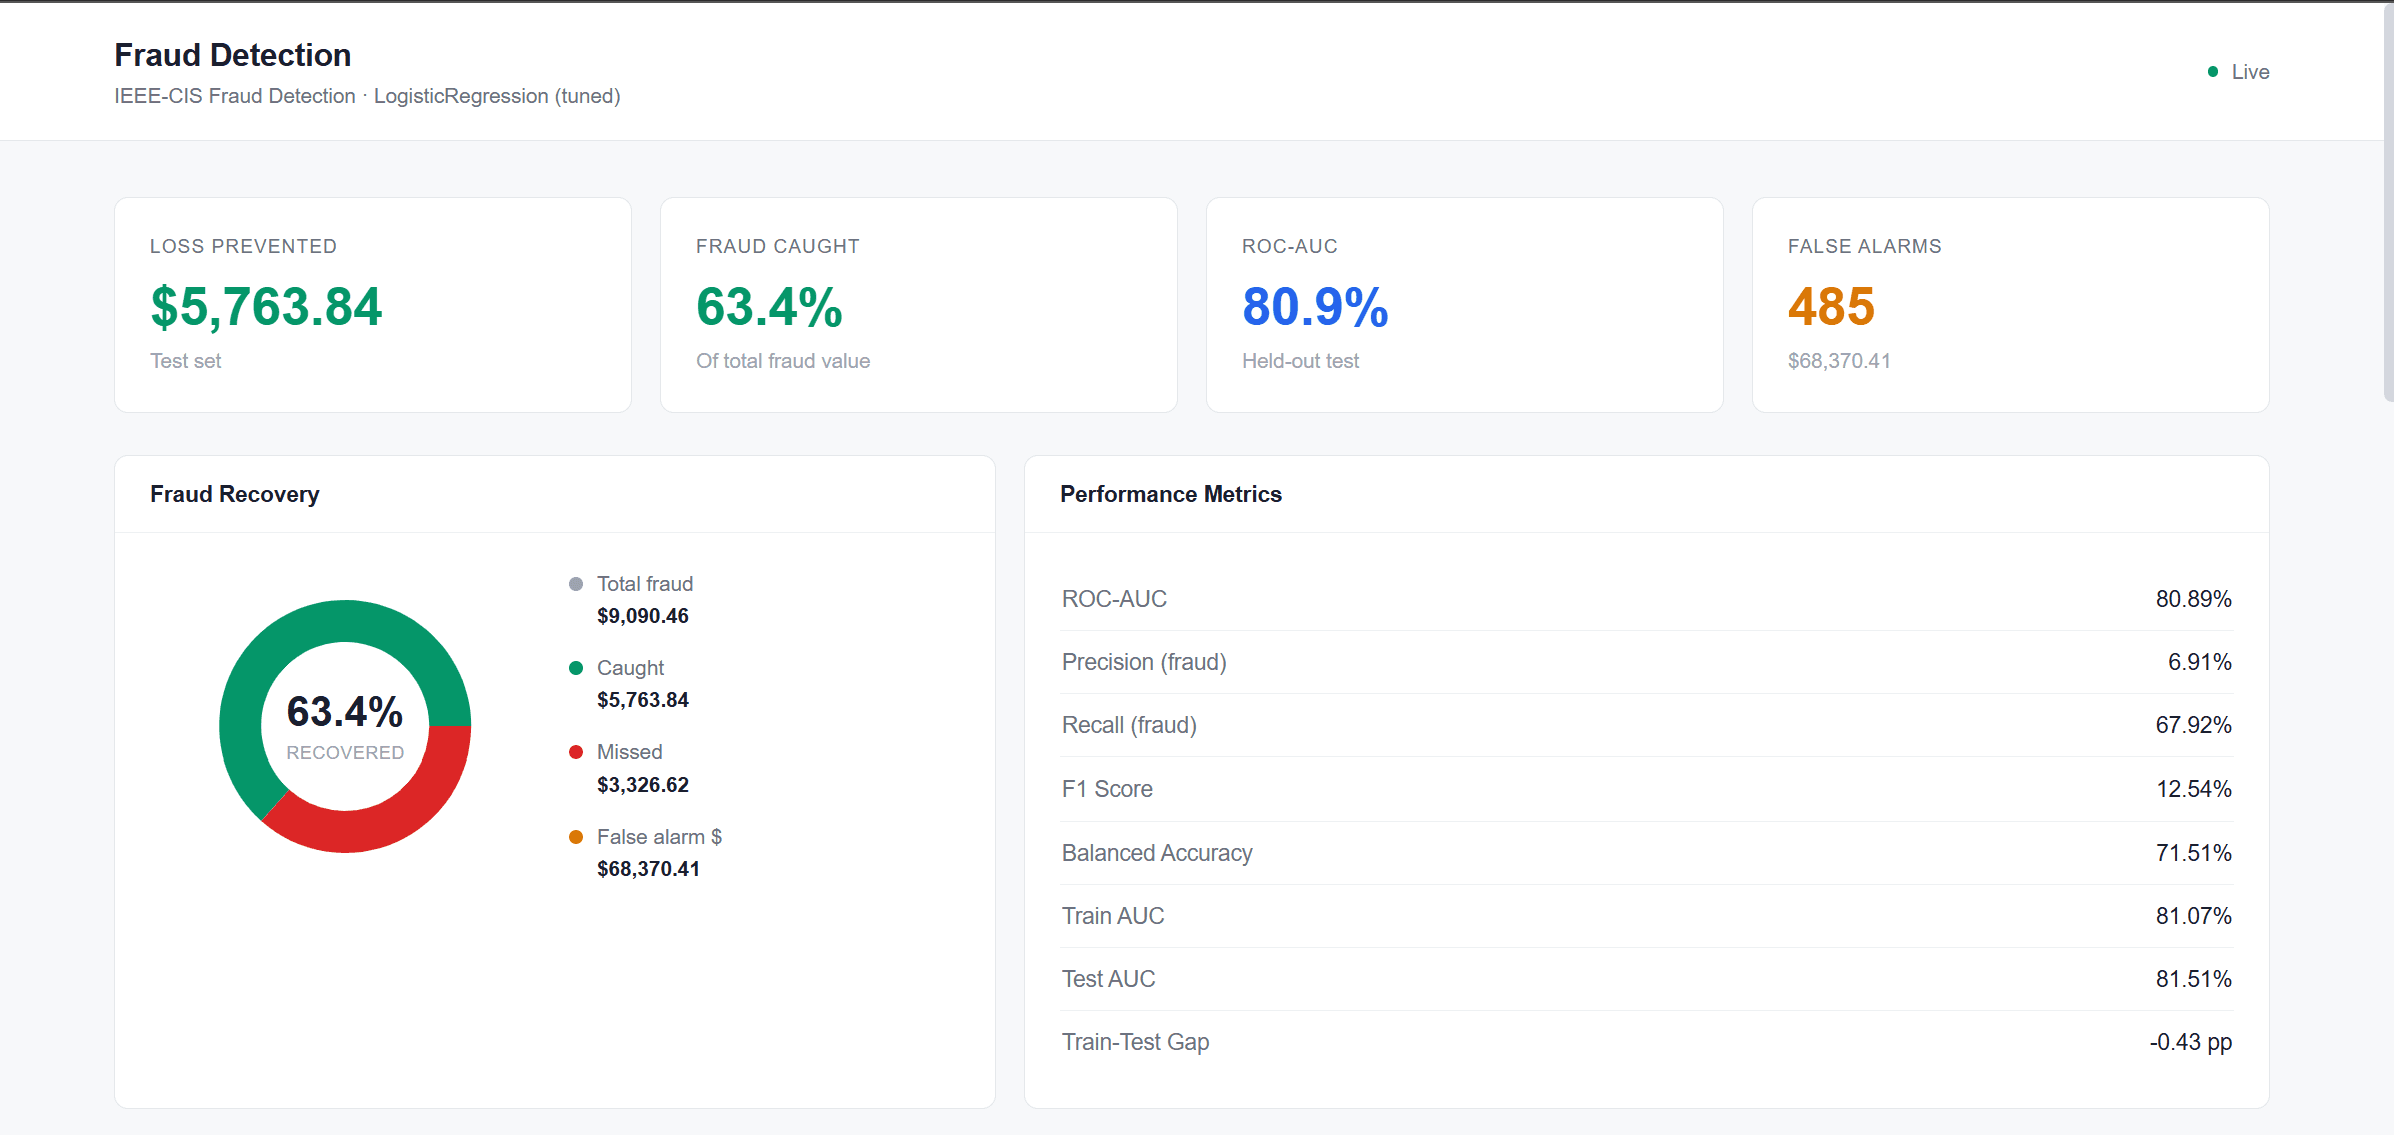
The model was evaluated on a held-out set of 2,000 transactions, of which 53 were fraudulent, or 2.65% of the sample. At the chosen threshold of 0.50 it caught 36 of them and missed 17.
That works out to 67.9% recall and 63.4% of the fraud value in the sample, $5,763.84 of $9,090.46. Precision is 6.9%, so of everything the model flagged, roughly 7 in 100 were actually fraud. It raised 485 false alarms to catch those 36 transactions.
The blunt version of that tradeoff: the model blocked $68,370 of legitimate transaction value to save $5,764 of fraud, an imbalance of about 12 to 1. Solid recall and a respectable AUC make it a reasonable first-pass screen, but the threshold needs to move before anyone would run this in production. Raising it to roughly 0.65 would cost some recall and cut false-alarm value by an order of magnitude, which is a far more defensible operating point.
F1 lands at 12.5% and MCC at 0.16, both dragged down by the precision shortfall. Balanced accuracy is 71.5%.
Train and test ROC-AUC are 0.811 and 0.815, a gap of essentially zero and slightly negative, so the model is not overfitting. Performance on genuinely new transactions should track close to these numbers.
Explainability
The IEEE-CIS features are anonymized. Columns arrive named V70, C12, and M6 with no published definitions, which makes the model a black box by default. A fraud score nobody can question is not worth acting on, regardless of its AUC.
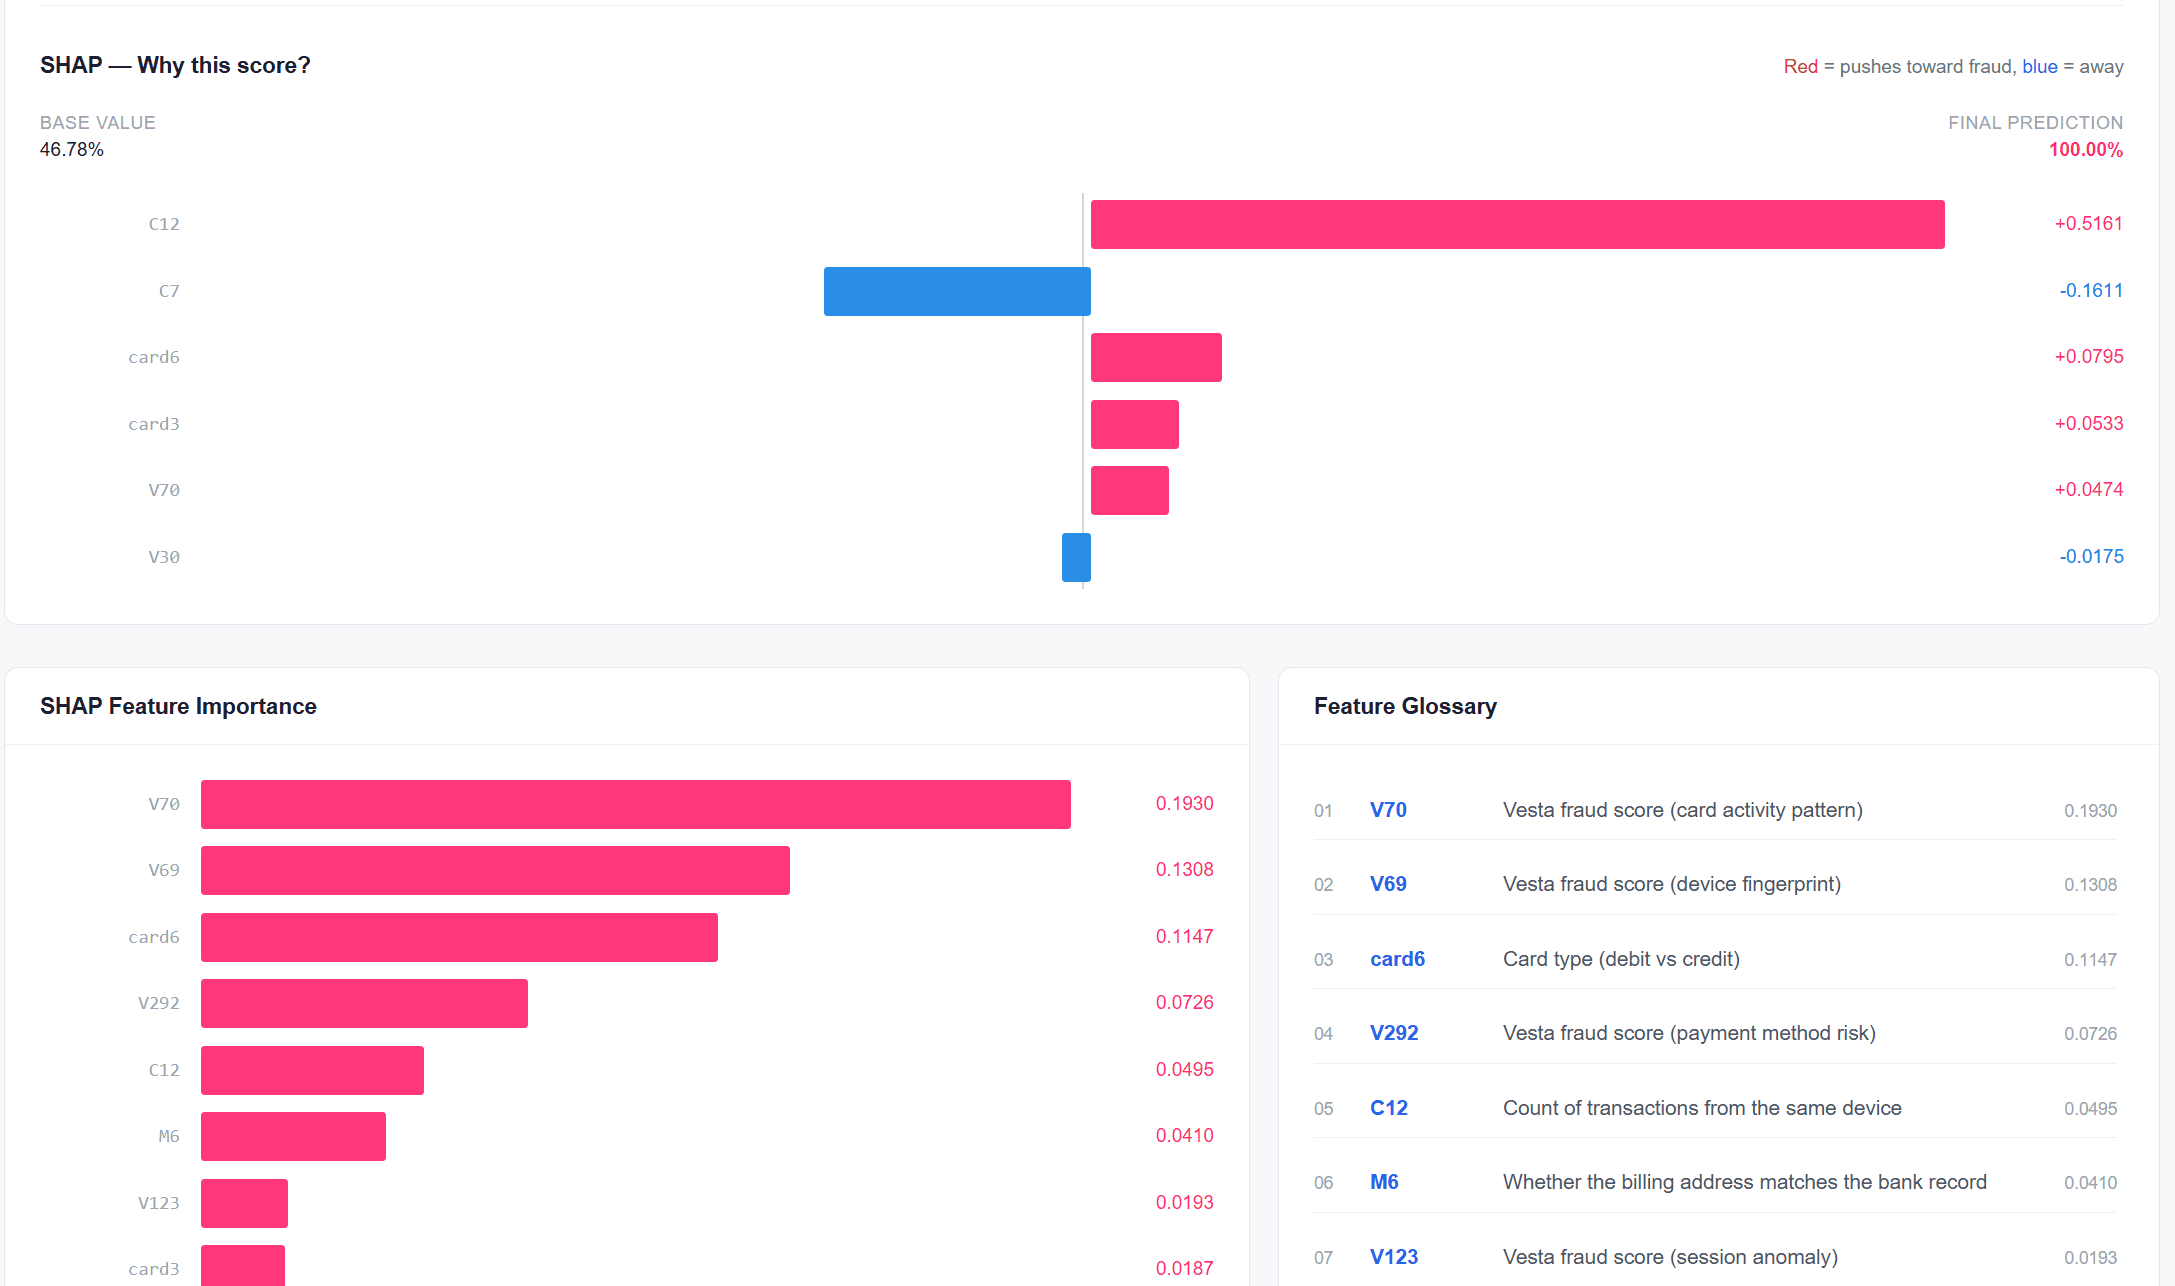
I used SHAP so every score decomposes into the features that produced it, starting from a base rate of 46.78%. The heaviest contributors are V70 and V69, which are Vesta's own card-activity and device-fingerprint scores, followed by card6, whether the card is debit or credit, and C12, the count of transactions coming from the same device. M6, whether the billing address matches the bank record, is a consistent risk signal throughout.
Every prediction in the dashboard ships with its own SHAP breakdown showing which features pushed that specific score up or down. I also wrote a plain language glossary for each feature, since a chart labeled V292 tells a reader nothing at all. Making the output readable took longer than training the model.
Limitations
Worth being direct about what this model is not.
Test ROC-AUC of 0.81 sits below the typical IEEE-CIS benchmark of 0.92 to 0.96, which gradient-boosted trees reach on the full dataset. Part of that is the model choice and part of it is the data: development used 10,000 rows out of roughly 590,000, so the rare patterns that matter most for novel attacks are thinly represented.
The train/test split was random rather than time-based. In production a model trained on January has to generalize to March, and fraud patterns shift seasonally and with new attack types. A random split flatters the AUC estimate, so real-world performance would likely come in lower than the numbers above.
The threshold was also tuned once and left alone, which is fine for a prototype and untenable for anything running continuously.
What I learned
- ROC-AUC of 0.81 and precision of 6.9% describe the same model. A single metric was never going to be enough to judge it by.
- Accuracy is meaningless when the positive class is 2.65% of the sample. The useful question is what each type of error costs in dollars, which is why the threshold is a business decision and not a modeling one.
- Explainability is not a bonus feature. If a score cannot be interrogated, nobody should be acting on it, and the same breakdown that helps an analyst is what a customer disputing a decline is entitled to.
- Serving predictions required building the feature vector on demand, from inputs shaped differently than the training data. That was the bulk of the deployment work.
Status
Complete as a class project. The SageMaker endpoint has since been retired, so the dashboard's scoring panel no longer returns live predictions. Every metric shown in the dashboard is a real result from the trained model.